UPDATE: 1:15 PM
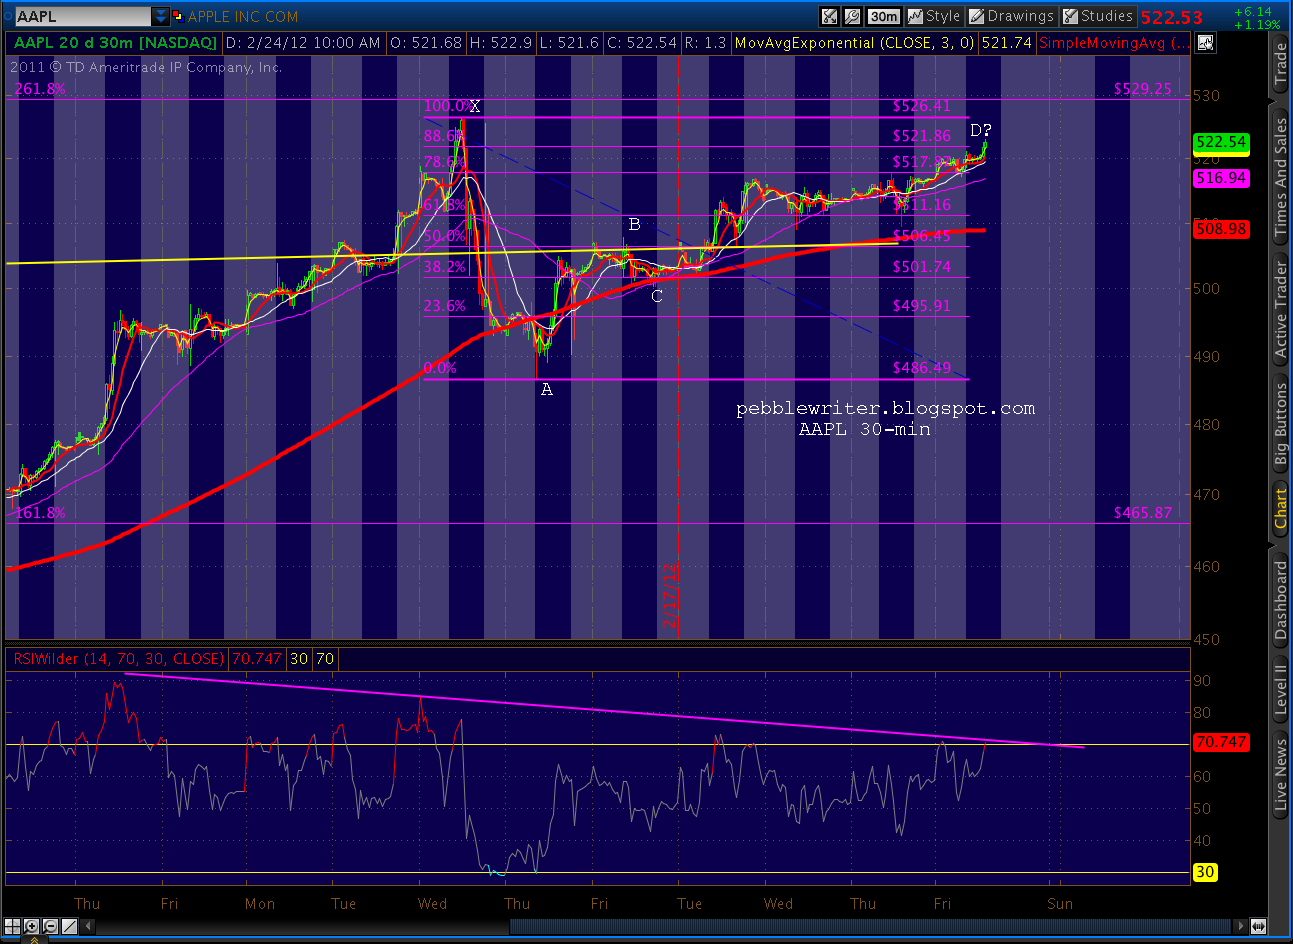
AAPL hit the (presumed) Bat target and has paused around 522. If it holds, look for the downturn to resume. If not, then the new target is 529.25.
Meanwhile, FactSet reports that, absent AAPL and AIG, last quarter's S&P 500 earnings growth would have been 1.1% rather than the 5.9% reported thus far. Wow.
UPDATE: 10:40 AM
Meanwhile, the dollar continues to slump, dropping through key support -- reportedly in response to expected additional QE (despite protestations to the contrary by various Fed gov's.) It's dropped below its Feb 9 low, but is looking very oversold in the short run.
If it can't remain above 78.43, I think we're looking at a drop to the 1.272 of 77.938 or even the 1.618 at 77.311, right next to the SMA 200 at 77.275 and a pretty clear channel line.
ORIGINAL POST
I'm hearing this grating refrain a lot lately. Besides friends, family, clients...I'm asking it of myself, staring into the mirror after a market like yesterday's when time seems to stand still.
One of the indicators I've been watching is AAPL. A thousand shares in 1997 would have bought you a used Aerostar van. A thousand shares today would buy you a brand new 56' Beneteau. AAPL is a leader amongst increasingly narrow leadership -- a bell cow among lemmings. As AAPL rumbles to new highs, bulls party like it's 1999. But, when AAPL stumbles, it takes the bulls down a notch -- sows a few seeds of doubt.
This morning, AAPL is flirting with the .886 of what might be a Bat pattern. We talked a few days ago [see: Just Do It] about AAPL's run-in with the trend line from 1994, negative divergence, the Crab within a Crab pattern, etc. Since the Feb 15 high, however, our attention has been on whether it was capable of making a new high.
For one thing, the smaller of the two Crabs has a 529.25 target that we didn't quite reach (we came up 3 pts short.) But, the reversal to 486 off the 526 high was impressive enough that we didn't care all that much at the time. Now, as SPX is inching back towards 1370, I find myself caring.
We've retraced nearly 88.6% of that 526 - 486 drop. Regular readers will recognize .886 as a Fib number associated with Bat patterns. They're set up by Point B's at less than a .618 retrace of the XA leg. In this case, our Point B was right around the .500 level, so there's a possibility it's a Bat.
The other alternative, however, is a Crab pattern -- which features a Point B up to the .886 retracement. The difference is in the outcome. Bats reverse course at the .886. Crabs go on and extend -- typically to the 1.618 level, but sometimes further (2.0, 2.24, 2.618, etc.)
One way to play a suspected Bat is to short just prior to the Point D, with a stop just beyond -- in case it turns into a Crab. The other imperative is to watch other technical indicators for evidence of a turn. In the case of AAPL, we have a pretty impressive TL on the 60-min RSI that suggests 521.86 will be the end of the retrace. But, I'd put a stop just above 527 just in case.
We got up to 521.10 this morning -- close enough, in my book for the pattern to be considered complete. But, I'd want to see a sell off before considering it done. SPX has exactly matched its intra-day high from Feb 21 of 1367.76, and seems to be thinking about a run higher. Whichever path it takes, it'll be easier if AAPL leads the way.
Stay tuned.
Friday, February 24, 2012
Thursday, February 23, 2012
Charts I'm Watching: February 23, 2012
ORIGINAL POST:
SPX just completed a little inverse H&S pattern that points toward 1372 -- the same level as the inverse H&S and just above the May 1370.58 high. I don't know whether we'll exceed 1370 or not, but it's a watershed mark for investors -- especially those who care about Elliott Wave theory.
This morning's attempt at a sell off had no juice behind it, and the bottom of the rising wedge held once again. Hitting 1372 would take us back to the upper bound of the rising wedge. And, the beat goes on...
VIX is off 1 pt as of this writing, taking prices as far south on the falling wedge as possible with re-entry. On the other hand, there's a TL on the RSI that supports the idea of a bounce. And, divergence is positive on both the daily and the hourly charts.
SBUX trying to rally, but the 60 min channel is holding so far.
The problem is the daily RSI TL, which looks like it's not ready to break just yet.
I'm closing the rest of my position for a slight loss and will try to reenter on the back test around 49.
**************
Re XRT, off the cuff I think the magic number is 64.44. There are overlapping Crab patterns that both point to the same price at their 1.618 extensions, and the rising wedge has plenty of room to accommodate it. The RSI and MACD would argue for a turn here, so maybe we see a dip along the way (59.96 @ 1.272?) to set up some negative divergence for the final push.
SPX just completed a little inverse H&S pattern that points toward 1372 -- the same level as the inverse H&S and just above the May 1370.58 high. I don't know whether we'll exceed 1370 or not, but it's a watershed mark for investors -- especially those who care about Elliott Wave theory.
This morning's attempt at a sell off had no juice behind it, and the bottom of the rising wedge held once again. Hitting 1372 would take us back to the upper bound of the rising wedge. And, the beat goes on...
VIX is off 1 pt as of this writing, taking prices as far south on the falling wedge as possible with re-entry. On the other hand, there's a TL on the RSI that supports the idea of a bounce. And, divergence is positive on both the daily and the hourly charts.
SBUX trying to rally, but the 60 min channel is holding so far.
The problem is the daily RSI TL, which looks like it's not ready to break just yet.
I'm closing the rest of my position for a slight loss and will try to reenter on the back test around 49.
**************
Re XRT, off the cuff I think the magic number is 64.44. There are overlapping Crab patterns that both point to the same price at their 1.618 extensions, and the rising wedge has plenty of room to accommodate it. The RSI and MACD would argue for a turn here, so maybe we see a dip along the way (59.96 @ 1.272?) to set up some negative divergence for the final push.
Wednesday, February 22, 2012
Just Do It -- February 22, 2012
UPDATE: EOD
NDX is still stuck at the apex of its rising wedge. Looks very vulnerable here, with an RSI TL tag and MACD rolling over to boot.
A lot has been written about AAPL, and its ability to bounce back above its recent highs. Remember, we saw its reversal coming a mile (well, 36 points) away [see Feb 11: More Crabapples.]
The stock had poked up above a trend line that extended back to 1994 (log scale), was neck deep in a rising wedge and was flashing very strong negative divergence.
Best of all, it was completing a Crab within a Crab pattern - one of my favorite short setups. Here's the chart from Feb 11 showing the trend line that, if broken, would result in a Crab completion at 529.
The rest, as they say, is history. AAPL got within 3 points of our target, then fell 40 points to 486 -- leaving a very bearish looking topping candle in its wake.
Since then, it's retraced about 78.6 of its losses; and, most financial writers are calling for new highs. While anything's possible for this amazing company, there's still a good case for further declines.
For one, rising wedges like touches on both boundaries -- and the lower bound is down there around 415 feeling very neglected. Second, Crab patterns are wont to retrace .618 of their XA moves, which in this case would be to around 426. And, last, AAPL is running into trouble with respect to its RSI chart.
Tags on the yellow and the red RSI trend lines have marked some pretty significant sell offs. While 40 points is nothing to sneeze at, it doesn't compare percentage-wise to some previous tags (e.g. 12.6% in July 2011, 9.5% in Sep 2011, 16.1% in Oct 2011 and 27% in Apr 2010.)
The yellow TL, in particular, exhibits some pretty massive negative divergence. Back in October 09, when that TL originated, AAPL was hovering around $200/share.
On the hourly chart, AAPL appears to be back testing the yellow, dashed RSI trend line. Unless the bottom falls out, it will likely complete a little Bat pattern -- tagging the .886 Fib at 521.77 at about the same time it runs into overhead resistance from that red, dashed TL.
From there, we could see a continued decline to the lower bound of the rising wedge for a 15-20% decline from recent highs -- a plunge that would likely accompany (if not precipitate) a general market decline.
Stay iTuned.
8:15 PM: This just in...check out the interesting post over at Zerohedge re the largest hedge fund holdings. AAPL comes in as the most crowded trade in the bunch.
UPDATE: 12:30 PM
Right on schedule, the bounce we talked about a bit ago (1355.53 vs 1355.87, oh well...)
The 60-min RSI has tagged a trend line that could resist any further downside. Decision time.
The daily chart RSI shows the back test of the previously broken trend line (in yellow) and the establishment of a new line (red) we need to break in order to confirm a downward break of the corresponding rising wedge.
Note: got stopped out on my remaining gold short position (for roughly a break-even) since prices have moved beyond the back test of the recently broken channel. I'm looking at 1800 as a likely re-entry point.
1802.70 is the 1.618 of the developing Crab pattern and should result in another touch of the fan line that brought the last reversal. I'll be especially interested if we see negative divergence continue to develop on the 60-min chart.
SBUX is rallying after a nice 5-day sell off from its rising wedge break. Judging from the 60-min RSI, it should reverse here and resume its decline. My target is 47.40, or a tag of the lower RSI TL, whichever comes first.
I still have half my original position left, and will let it ride unless we break the downward sloping TL on the RSI -- probably around 48.35.
I've been tempted to blow out MSFT shorts, but until it can break the Apr 23 2010 high (31.58) and/or overcome the neg divergence, I'll hang in there.
It hit 31.68 intra-day today, but reversed off that to close down .54% at 31.27 -- so far, a triple top that's failed to keep up with S&P 500 or NDX.
Among other high-flyers, GOOG is tracing out a H&S pattern in the wee small hours of its rising wedge. A break below 565 could see it revisit its June 2011 lows of 480.
ORIGINAL POST: 11:00 AM
Don't you just love waiting? After a prolonged melt up like we've had the past two months (feels like six), we're all more than ready for a turn. Even the bulls are getting antsy.
As we discussed yesterday, there are multiple risks to the bull case immediately overhead. In the meantime, we completed a little Crab pattern on Monday that should see SPX back down to 1348 or so (.618 of the XA distance.) But, watch out for at least a pause at 1355.87 -- the wedge lower boundary and horizontal support off the Feb 15 high. Depending on selling volume, the decline could reverse there and go on to tackle some of the overhead targets.
A decline to 1348 would be significant in itself, but of more significance is that it'll take SPX below the rising wedge that's formed over the past three months. This wedge has been broken before, and has handled it by widening the original path. Since it's been about as trustworthy as a central banker, we'll watch this one very carefully.
More later.
NDX is still stuck at the apex of its rising wedge. Looks very vulnerable here, with an RSI TL tag and MACD rolling over to boot.
A lot has been written about AAPL, and its ability to bounce back above its recent highs. Remember, we saw its reversal coming a mile (well, 36 points) away [see Feb 11: More Crabapples.]
The stock had poked up above a trend line that extended back to 1994 (log scale), was neck deep in a rising wedge and was flashing very strong negative divergence.
Best of all, it was completing a Crab within a Crab pattern - one of my favorite short setups. Here's the chart from Feb 11 showing the trend line that, if broken, would result in a Crab completion at 529.
The rest, as they say, is history. AAPL got within 3 points of our target, then fell 40 points to 486 -- leaving a very bearish looking topping candle in its wake.
Since then, it's retraced about 78.6 of its losses; and, most financial writers are calling for new highs. While anything's possible for this amazing company, there's still a good case for further declines.
For one, rising wedges like touches on both boundaries -- and the lower bound is down there around 415 feeling very neglected. Second, Crab patterns are wont to retrace .618 of their XA moves, which in this case would be to around 426. And, last, AAPL is running into trouble with respect to its RSI chart.
Tags on the yellow and the red RSI trend lines have marked some pretty significant sell offs. While 40 points is nothing to sneeze at, it doesn't compare percentage-wise to some previous tags (e.g. 12.6% in July 2011, 9.5% in Sep 2011, 16.1% in Oct 2011 and 27% in Apr 2010.)
The yellow TL, in particular, exhibits some pretty massive negative divergence. Back in October 09, when that TL originated, AAPL was hovering around $200/share.
On the hourly chart, AAPL appears to be back testing the yellow, dashed RSI trend line. Unless the bottom falls out, it will likely complete a little Bat pattern -- tagging the .886 Fib at 521.77 at about the same time it runs into overhead resistance from that red, dashed TL.
From there, we could see a continued decline to the lower bound of the rising wedge for a 15-20% decline from recent highs -- a plunge that would likely accompany (if not precipitate) a general market decline.
Stay iTuned.
8:15 PM: This just in...check out the interesting post over at Zerohedge re the largest hedge fund holdings. AAPL comes in as the most crowded trade in the bunch.
UPDATE: 12:30 PM
Right on schedule, the bounce we talked about a bit ago (1355.53 vs 1355.87, oh well...)
The 60-min RSI has tagged a trend line that could resist any further downside. Decision time.
The daily chart RSI shows the back test of the previously broken trend line (in yellow) and the establishment of a new line (red) we need to break in order to confirm a downward break of the corresponding rising wedge.
Note: got stopped out on my remaining gold short position (for roughly a break-even) since prices have moved beyond the back test of the recently broken channel. I'm looking at 1800 as a likely re-entry point.
1802.70 is the 1.618 of the developing Crab pattern and should result in another touch of the fan line that brought the last reversal. I'll be especially interested if we see negative divergence continue to develop on the 60-min chart.
SBUX is rallying after a nice 5-day sell off from its rising wedge break. Judging from the 60-min RSI, it should reverse here and resume its decline. My target is 47.40, or a tag of the lower RSI TL, whichever comes first.
I still have half my original position left, and will let it ride unless we break the downward sloping TL on the RSI -- probably around 48.35.
I've been tempted to blow out MSFT shorts, but until it can break the Apr 23 2010 high (31.58) and/or overcome the neg divergence, I'll hang in there.
It hit 31.68 intra-day today, but reversed off that to close down .54% at 31.27 -- so far, a triple top that's failed to keep up with S&P 500 or NDX.
Among other high-flyers, GOOG is tracing out a H&S pattern in the wee small hours of its rising wedge. A break below 565 could see it revisit its June 2011 lows of 480.
ORIGINAL POST: 11:00 AM
Don't you just love waiting? After a prolonged melt up like we've had the past two months (feels like six), we're all more than ready for a turn. Even the bulls are getting antsy.
As we discussed yesterday, there are multiple risks to the bull case immediately overhead. In the meantime, we completed a little Crab pattern on Monday that should see SPX back down to 1348 or so (.618 of the XA distance.) But, watch out for at least a pause at 1355.87 -- the wedge lower boundary and horizontal support off the Feb 15 high. Depending on selling volume, the decline could reverse there and go on to tackle some of the overhead targets.
A decline to 1348 would be significant in itself, but of more significance is that it'll take SPX below the rising wedge that's formed over the past three months. This wedge has been broken before, and has handled it by widening the original path. Since it's been about as trustworthy as a central banker, we'll watch this one very carefully.
More later.
Tuesday, February 21, 2012
Charts I'm Watching: February 21, 2012
UPDATE: 1:50 PM
SPX faces a gauntlet of overhead challenges, seen here on the 60-min chart:
RUT Bat and Crab pattern highs continue to hold.
NDX, like just about every other index, spent the past few days churning. Its RSI, also like just about everything else I'm watching, is back testing a broken trend line and is beginning to show negative divergence on the daily chart.
ORIGINAL POST:
At long last, the Greek deal is done. But, there's lots of hair on the deal, and the market is rightly unimpressed with the futures up a mere 3 points at this writing.
The melt up has the potential to tack on another 12 points in the eminis -- with a 1376.85 Butterfly pattern completion up ahead. This is a smidge higher than the May 1373.50 high, so it has the ability to rewrite a lot of Elliott Wave history.
It also roughly coincides with the most generous rising wedge I can draw -- not to mention the inverse H&S pattern. First, the big picture:
And, a little closer look:
The rising wedge formed with the fan line from Mar 09 is obvious (though I never thought it would grow to include the Oct 27 aberration.) It also has a lot of open space near its upper bound, making it look a bit hinky.
Drawing a tighter upper bound (purple line) looks a little better, but it also looks a little less ominous. So, pick your poison. I think the Butterfly will spell a reversal, especially given that it's in such close proximity to the previous high.
Just like SPX, the eminis didn't quite reach their Gartley target at the .786 Fib level of 1389.66 back in May. If, for whatever reason, we should overshoot the double top at 1373.5 or the Butterfly at 1376.85, then the original Gartley level should produce a strong reversal.
The corresponding values for SPX are shown in the chart below:
Note that they're a little more compressed in SPX, and that we're already within striking distance of any of the three -- close enough, in fact, that this rally could fizzle at any time.
Go back and study 2007. Remember the 90's bull market finally topped out at 1552.87 in March of 2000. And, though there were plenty of reasons for the market not to make it back there after plunging to 768, by October 2007 it came back to 1576.09 -- 23 points higher than in 2000.
Then, as now, the majority of analysts saw besting the old high as a clear sign of higher prices to come. Of course, we ended up with a lower low, shedding 58% in the next 17 months.
What I'm trying to say is, the bear case is not dashed if we exceed 1370. We have two other very strong causes for a reversal waiting in the wings. And, the commonly accepted EW count can be dead wrong without it meaning we should ignore the crumbling global economic picture, not to mention all these bearish chart patterns, and suddenly turn bullish.
More later.
SPX faces a gauntlet of overhead challenges, seen here on the 60-min chart:
Previous High: 1370.58
Inverse H&S: 1372.00
Butterfly 1.618: 1375.47
Gartley (2007) .786: 1381.50
Rising Wedge Apex: 1392.23
RUT Bat and Crab pattern highs continue to hold.
NDX, like just about every other index, spent the past few days churning. Its RSI, also like just about everything else I'm watching, is back testing a broken trend line and is beginning to show negative divergence on the daily chart.
ORIGINAL POST:
At long last, the Greek deal is done. But, there's lots of hair on the deal, and the market is rightly unimpressed with the futures up a mere 3 points at this writing.
The melt up has the potential to tack on another 12 points in the eminis -- with a 1376.85 Butterfly pattern completion up ahead. This is a smidge higher than the May 1373.50 high, so it has the ability to rewrite a lot of Elliott Wave history.
It also roughly coincides with the most generous rising wedge I can draw -- not to mention the inverse H&S pattern. First, the big picture:
And, a little closer look:
The rising wedge formed with the fan line from Mar 09 is obvious (though I never thought it would grow to include the Oct 27 aberration.) It also has a lot of open space near its upper bound, making it look a bit hinky.
Drawing a tighter upper bound (purple line) looks a little better, but it also looks a little less ominous. So, pick your poison. I think the Butterfly will spell a reversal, especially given that it's in such close proximity to the previous high.
Just like SPX, the eminis didn't quite reach their Gartley target at the .786 Fib level of 1389.66 back in May. If, for whatever reason, we should overshoot the double top at 1373.5 or the Butterfly at 1376.85, then the original Gartley level should produce a strong reversal.
The corresponding values for SPX are shown in the chart below:
Note that they're a little more compressed in SPX, and that we're already within striking distance of any of the three -- close enough, in fact, that this rally could fizzle at any time.
Go back and study 2007. Remember the 90's bull market finally topped out at 1552.87 in March of 2000. And, though there were plenty of reasons for the market not to make it back there after plunging to 768, by October 2007 it came back to 1576.09 -- 23 points higher than in 2000.
Then, as now, the majority of analysts saw besting the old high as a clear sign of higher prices to come. Of course, we ended up with a lower low, shedding 58% in the next 17 months.
What I'm trying to say is, the bear case is not dashed if we exceed 1370. We have two other very strong causes for a reversal waiting in the wings. And, the commonly accepted EW count can be dead wrong without it meaning we should ignore the crumbling global economic picture, not to mention all these bearish chart patterns, and suddenly turn bullish.
More later.
Friday, February 17, 2012
OPEX Head Fake? -- February 17, 2012
Just came across this fascinating quote over at Zerohedge. It speaks volumes. The most chilling part is the last five words of the attribution.
Still traveling, so this will be brief.
Yesterday's action has shaken the faith of lots of bears, exactly what you would expect under the circumstances. Despite the fact that SPX set a new high and is closing in on 1370, the push has been on narrow leadership and weak volume.
My premise is that the situation in Europe is not going well and, since we're talking countries rather than companies, this will end worse than Bear Stearns/Lehman/AIG. I don't see anything on the horizon that will "fix" the problem, although resolution could be delayed if the EZ possessed the political will/unity to do so. For that contingency, I maintain stops at a reasonable level.
I believe EURUSD has completed a nice back test of a big-ass H&S pattern that just so happens to target 1.12 -- the bottom of the flag pattern that's been tracing out for the past 4 years. I think the next move down will be very significant, probably skipping a channel or two on its way down.
There's a little H&S pattern that's set up over the past three weeks that'll start the ball rolling with a break below 1.30.
The dollar fell yesterday, but it felt more corrective than impulsive. We've made a series of higher highs and higher lows since our Feb 7 call for a turn -- despite the fact that SPX hasn't cooperated in the least. I haven't touched the chart from back then, because the fan lines continue to do their thing.
Could anything go wrong? Sure. Note that the yellow dashed fan line that provided the last turn could also serve as a nifty neckline for a H&S topping pattern. If prices touch that line, I'll give up my bullish position and let the dust settle. But, for now, I'm still looking at a target around 87+ -- the top of the flag pattern. It will correspond with a powerful equities dump.
I was stopped out of my VIX calls yesterday, but have jumped back in at a lower price. Looking at the chart, we've made a lower right shoulder on the IH&S pattern. Until it moves lower than the head, it's still intact. Today's low makes for a very convincing back test -- without even re-entering the falling wedge.
XLF hasn't participated in SPX's new high, completing a goofy Gartley with a back test at the .786 of its recent slide. I added to my bearish position there. Likewise with Starbucks, which completed its own rising wedge back test with a Gartley pattern at a .786 retrace.
Gold continues to move sideways after leaving the upward sloping channel the other day. I think it's tracing out a flag that should see it back below 1700 in the next few days.
And, last, because I have to dash... SPX just completed another Crab pattern at its high for the day.
SPX is still backtesting its rising wedge -- just at a higher price (which none of my other positions did, BTW; nor did AAPL.)
But the thing that kept me from blowing out of the position yesterday was the fact that its RSI never regained its trend line. For now, it's simply a back test of a rather meaningful trend line.
I won't be able to post again until tomorrow, as I'll be attending a friend's funeral and wake this afternoon. I wish you all good luck.
“Whoever controls the volume of money in our country is absolute master of all industry and commerce…and when you realize that the entire system is very easily controlled, one way or another, by few powerful men at the top, you will not have to be told how periods of inflation and depression originate.” – President James Garfield, two weeks before his assassination.
*******
Still traveling, so this will be brief.
Yesterday's action has shaken the faith of lots of bears, exactly what you would expect under the circumstances. Despite the fact that SPX set a new high and is closing in on 1370, the push has been on narrow leadership and weak volume.
My premise is that the situation in Europe is not going well and, since we're talking countries rather than companies, this will end worse than Bear Stearns/Lehman/AIG. I don't see anything on the horizon that will "fix" the problem, although resolution could be delayed if the EZ possessed the political will/unity to do so. For that contingency, I maintain stops at a reasonable level.
I believe EURUSD has completed a nice back test of a big-ass H&S pattern that just so happens to target 1.12 -- the bottom of the flag pattern that's been tracing out for the past 4 years. I think the next move down will be very significant, probably skipping a channel or two on its way down.
The dollar fell yesterday, but it felt more corrective than impulsive. We've made a series of higher highs and higher lows since our Feb 7 call for a turn -- despite the fact that SPX hasn't cooperated in the least. I haven't touched the chart from back then, because the fan lines continue to do their thing.
Could anything go wrong? Sure. Note that the yellow dashed fan line that provided the last turn could also serve as a nifty neckline for a H&S topping pattern. If prices touch that line, I'll give up my bullish position and let the dust settle. But, for now, I'm still looking at a target around 87+ -- the top of the flag pattern. It will correspond with a powerful equities dump.
I was stopped out of my VIX calls yesterday, but have jumped back in at a lower price. Looking at the chart, we've made a lower right shoulder on the IH&S pattern. Until it moves lower than the head, it's still intact. Today's low makes for a very convincing back test -- without even re-entering the falling wedge.
XLF hasn't participated in SPX's new high, completing a goofy Gartley with a back test at the .786 of its recent slide. I added to my bearish position there. Likewise with Starbucks, which completed its own rising wedge back test with a Gartley pattern at a .786 retrace.
Gold continues to move sideways after leaving the upward sloping channel the other day. I think it's tracing out a flag that should see it back below 1700 in the next few days.
And, last, because I have to dash... SPX just completed another Crab pattern at its high for the day.
SPX is still backtesting its rising wedge -- just at a higher price (which none of my other positions did, BTW; nor did AAPL.)
But the thing that kept me from blowing out of the position yesterday was the fact that its RSI never regained its trend line. For now, it's simply a back test of a rather meaningful trend line.
I won't be able to post again until tomorrow, as I'll be attending a friend's funeral and wake this afternoon. I wish you all good luck.
Thursday, February 16, 2012
Charts I'm Watching: February 16, 2012
ORIGINAL POST: 2:30 AM
I'm traveling over the balance of the week, so posts will be a bit spotty.
After bouncing around quite a bit, SPX ended the day on a solid down note. We closed below the rising wedge, but not quite enough to put a fork in Wave 2 just yet. I'm looking for a close below 1340 (Tuesday's low) for starters.
Ideally, we'll see a bounce up to 1350 to back test the wedge and complete a small H&S pattern before heading south. Given that Friday is OPEX, I think it's actually fairly likely -- unless we have the massive sell-off that's entirely possible with a market that's this far stretched on the upside.
Daily RSI broke its trend line, and has a ways to go before finding support. My gut tells me 1355.87 was the Wave 2 top, so I've added some short positions. I'm long puts on SPY (tight stops), SBUX, AAPL, XLF and MSFT and calls on VIX on the IHS completion.
I'm also long the dollar and short the euro and gold. I'm expecting the euro situation to worsen over the next few days, and at least a .05 move in EURUSD in near term. Look at the past patterns and you can get an idea what can happen when EURUSD jumps channels.
AAPL came very close to our 529 target and reversed hard. At 19% of the NDX, it should take the rest of the tech sector with it. MSFT completed a well-defined Crab a few days ago, and is reversing nicely now.
Gold continues to come under pressure, although prices have been choppy. I expect it to sell off with the rest of the market next week, if not sooner; but, I'd bail at a move over 1765.
I'll add to positions if/when the downside gets going, but am the equivalent of about 40% net short, with options comprising about half of that.
One thing I'm considering doing on the new website is posting actual trades in a model portfolio. If this interests you, let me know. The only tricky aspect is putting on trades that the average investor would feel comfortable following: ETF's, long puts and calls, spreads, straddles (nothing fancy). I would stay away from futures and most individual stock names. Please give me your thoughts.
Good luck to all.
I'm traveling over the balance of the week, so posts will be a bit spotty.
After bouncing around quite a bit, SPX ended the day on a solid down note. We closed below the rising wedge, but not quite enough to put a fork in Wave 2 just yet. I'm looking for a close below 1340 (Tuesday's low) for starters.
Ideally, we'll see a bounce up to 1350 to back test the wedge and complete a small H&S pattern before heading south. Given that Friday is OPEX, I think it's actually fairly likely -- unless we have the massive sell-off that's entirely possible with a market that's this far stretched on the upside.
Daily RSI broke its trend line, and has a ways to go before finding support. My gut tells me 1355.87 was the Wave 2 top, so I've added some short positions. I'm long puts on SPY (tight stops), SBUX, AAPL, XLF and MSFT and calls on VIX on the IHS completion.
I'm also long the dollar and short the euro and gold. I'm expecting the euro situation to worsen over the next few days, and at least a .05 move in EURUSD in near term. Look at the past patterns and you can get an idea what can happen when EURUSD jumps channels.
![]() |
| Weekly |
![]() |
| Daily |
Gold continues to come under pressure, although prices have been choppy. I expect it to sell off with the rest of the market next week, if not sooner; but, I'd bail at a move over 1765.
I'll add to positions if/when the downside gets going, but am the equivalent of about 40% net short, with options comprising about half of that.
One thing I'm considering doing on the new website is posting actual trades in a model portfolio. If this interests you, let me know. The only tricky aspect is putting on trades that the average investor would feel comfortable following: ETF's, long puts and calls, spreads, straddles (nothing fancy). I would stay away from futures and most individual stock names. Please give me your thoughts.
Good luck to all.
Subscribe to:
Posts (Atom)


