Wednesday, February 15, 2012

Charts I'm Watching: February 15, 2012

UPDATE:  3:30 PM

Revised H&S picture for SPX.  Whether this holds or not, we've clearly broken down below the rising wedge.  The trick will be to close below it and, specifically, below yesterday's low of 1340.83.


UPDATE:  2:15 PM

VIX just completed the IH&S pattern we've been watching for several weeks.  The nominal target is 25.85 -- more than enough to feed the next biggest pattern up the food chain.  This, in turn, will feed a bigger pattern, etc.  See the big picture repercussions here


This should get things going for SPX, currently off 4.64.  If we close below 1340 today, 1355.87 will look like the Wave 2 top.   It's 2.02 above the 1.618 extension on our latest Butterfly pattern (from 1333 to 1300) and is a remarkable 95.03 retracement of the 1370 - 1074 decline.

UPDATE:  1:00 PM

Looks like a beautiful shorting opportunity in Starbucks (SBUX.)  I can't resist the Mar 46 puts at .42.


UPDATE:  11:45 AM

AAPL off to the races again today.  A reminder, 529.25 is the 2.618 extension on the big Crab pattern we've been watching [see: More Crabapples].  We're also in nosebleed territory, having poked up through the trend line that dates back to 1994.  Look for a serious reversal, maybe enough to mark the top.


UPDATE:  11:00 AM

Well, that has to be one of the weirdest openings I can remember.  The futures were fading fast as the opening bell approached.  The cash market had little to no momentum at all, having reversed off the Butterfly pattern I discussed in the prior post.  It fell from 1358 to 1350.75 from 7:30 to 8:15, feeling trĂ©s motive, BTW.
 

We saw a 50% retrace back to 1354 from 8:15 to 9:13; then, another motivey plunge got going.  As 9:30 approached, the eminis were at 1350.75 -- well below the head of our H&S pattern -- and heading south fast.  With any luck, the pattern would be left intact and we could get started wrapping up Wave 2.  If only life were that simple.

The cash market opened and market makers, recognizing the huge shooting star being formed in SPX, freaked out.  Not being the types to let a bearish pattern stand -- especially with OPEX coming up in two days --  they threw everything including the kitchen sink into the market.  

They ramped.  What should have been a down or flat opening (futures were at 1350.75, versus yesterday's cash close of 1350.34) and pumped it up to 1354.72 -- 40 cents higher than the previous close and perfectly good H&S head.


Does it kill the H&S pattern?  Yep.  It certainly sows seeds of doubt into the EW count, since we now have a higher high -- scam turd though it may be.   If nothing else, it extends Wave 2 another hour/day/week until something too big to sweep under the rug comes along.

*********

I almost forgot to mention...the news snippet that upset the bulls' apple cart last night.  Among other things, it appears that TPTB across the pond aren't so sure that the conditions they set for bailing out Greece were enough.  They're "mulling whether to delay a full bailout package for the country [Greece] until after the country's elections."  In other words, they want the pledges of the currently elected officials and those who haven't yet been appointed elected.


This is the EU version of demanding another shrubbery.  Demands to cut down the mightiest tree in the forest with a herring are sure to follow.


Right on cue, we get this priceless quote from Greek President Papoulias, who "tore into Germany's finance minister, the Netherlands and Finland for taunting the country's troubled recovery efforts as Athens fights to stay in the euro zone and avert default."
I do not accept having my country taunted by Mr Schaeuble, as a Greek I do not accept it....Who is Mr Schaeuble to taunt Greece?  Who are the Dutch?  Who are the Finns?"

According to unnamed sources, Mr Schaeuble became quite agitated at Mr Papoulias' reaction.  At great personal expense, I have obtained this secret footage of the exchange.


ORIGINAL POST:  2:30 AM

I posted the other day about the rising wedge on SPX and, specifically the eminis, commenting: "it has to break down or break out...something's gotta give."  Well, how about a break down and break out?


SPX broke below its rising wedge today.  Shortly before the close, it back tested the wedge, looking weak as it did so.  Then came the spike.  Apparently someone leaked the news that the Chinese had decided they could solve the world's financial problems (or, at least Europe's) and SPX spiked almost 10 points in a jiffy.

By the time the news was actually released several hours later, the eminis had spiked another 11 points.  As I write this, they have rallied so far as to complete a little Butterfly pattern at the 1.272 extension at 1355.75, so don't be surprised if the whole thing reverses back to GO.

Looking at the cash market, the level at which we open matters a lot.  If we exceed 1354.32, the H&S pattern craps out -- not the end of the world for bears, but it changes the count a bit.   Many EW practitioners have been calling for a slightly higher 5th wave to end Minor 2.  As long as we stay below 1370, all is well in Elliott World.


BTW, we're seeing the same kind of divergence we saw 24 hours ago -- with equities up much more than the corresponding anemic bump in EUR and AUD.  Don't you suppose that if the euro problems were solved, we'd see more of a reaction in the currency than in US equities rather than less?  Just saying...

Stay tuned.

Tuesday, February 14, 2012

Retail Sales

As usual, the economic headlines from MSM are wrong -- focusing on the 0.4% seasonally adjusted increase rather than the actual 21% decrease from $459.8 in December to $361.4 billion in January.  Wait, you say, you can't compare January and December, with all that holiday shopping included!  That's true, an adjustment is appropriate -- just not the adjustment Census packed in there.

Charts I'm Watching: February 14, 2012

UPDATE:  1:25 PM

VIX is coming to life, again.  We had a breakout of the small falling wedge inside the large falling wedge, then a breakout of the large falling wedge itself.  It was followed by a successful back test.


A rise to 21.13 or so will complete an Inverse Head & Shoulder pattern that targets 25+.


A corresponding drop in SPX to 1339 will complete the bearish (for stocks) H&S pattern there.

UPDATE:  12:40 PM

For anyone following the USDJPY, we've seen a pretty strong move today - rising above the SMA 200.  But, a genuine break out will take some doing.  On a log scale, the purple TL/channel guiding prices since 2007 is still intact.   Most troubling for the bullish case is the RSI, which looks to be tagging a TL that's not been very accommodative.

USDJPY Weekly
Look for a rise through the purple TL, currently 78.54.   A rise above the Oct 31 high of 79.52 would constitute a more bullish wave form.

USDJPY Daily
And, just for grins...


UPDATE:  10:15 AM

AAPL taking a pause right at the 2.24 Fib level we talked about over the weekend.  Note that 2.24 is an acceptable Crab target (1.618, 2.24, 2.618, etc.)  This also intersects with the trend line from 1994 we discussed over the weekend [see: More Crabapples].


Anyone playing the downside from here, however, would be well advised to place prudent stops; the next significant Fib level is way up at 529.

UPDATE:  9:15 AM

Eminis flashing -5 at this time.  SPX will need to trade below 1339 (10 SMA) to confirm the change in momentum and complete the first Head & Shoulders pattern, while 1343 would take prices below the rising wedge.  


ORIGINAL POST:  8:45 AM

EURUSD has broken down from the rising wedge it's been tracing out (since the first of the year) and completed a successful back test.   It bounced off the SMA 20 last night, having broken through the SMA 10 yesterday.  Further, the EMA 3 crossed below the SMA 10 with the rising wedge break.


I always label my moving averages the same -- just to make it easier to keep track of them on busy charts:
3 EMA:  yellow
10 SMA:  red
20 SMA: white
50 SMA: blue
200 SMA:  thicker red

More later.

Monday, February 13, 2012

Charts I'm Watching: February 13, 2012

UPDATE:  9:30 PM

In the 12:15 post earlier, I discussed the two possible harmonic paths for EURUSD.  The path higher has been all but eliminated thanks to a dip below the presumed Point A.


This dip is a break down from the rising wedge and, on its own, would target the wedge base of 1.2623.  But, I've got my sights set on bigger prizes -- namely 1.2464 on the way to 1.1597.


Here's a medium close up of the jumbled mess surrounding today's action:


UPDATE:  2:00 PM

We're on the brink of either a break-out or break-down, with the market refusing to show its cards.  The 5-min chart perfectly illustrates:


The purple Bat pattern reversed this morning at its .886, as it should.   Since then, it's traced out a smaller (red) Bat pattern that's stalled at its .886 -- which is right back to where the first pattern's .886 was!

If we can hold here, it's a 1-2-1-2 with the next move down sharply.  Otherwise, there's a pretty obvious 5 waves up being traced out, starting at Friday's 1337 low.  Since we're so close to the presumed top of 1354.32, it's a pretty simple matter to set stops for those inclined to take a bearish position.

Likewise, anyone playing the upside breakout would do well to set stops around 1346ish.

UPDATE:  12:15 PM

Euro rally still muted, with the daily charts pointing to a decline...


 ...though, in the short run, a slightly higher alternative is a possibility.  Since Gartley's complete at a .786 Fib retracement, I'm always on the lookout for that Point D to become a Point B in a larger Butterfly pattern (purple).

The pattern that points to the downside and fulfills the break down from the rising wedge is a Crab (in red.)  We'll want to keep an eye on 1.3027 on the downside and 1.3320 on the upside.


UPDATE:  11:00 AM

VIX is back testing its recent break out of a falling wedge.


UPDATE:  10:20 AM


I believe this is my first ever copper chart.  If, as many believe, it's a valid indicator for the stock market, the implications are bearish.


UPDATE:  9:40 AM

The 1354.32 high is still intact, as SPX slightly exceeded our .886 target of 1352.39 at 1352.63.  If all we get is this bearish Bat pattern inside the recently completed bearish Crab pattern, we should see downside momentum pick up throughout the day.


ORIGINAL POST:  9:00 AM

Since the Greek parliament voted to throw their citizenry (almost goofed and called them constituents!) under the bus yesterday afternoon, the euro has rallied predictably.  But, what an incredibly anemic rally... from Friday's close at 1.3195 to a high of 1.3283 overnight to complete a bearish Gartley pattern on the 60-min chart.  This represents a 78.6% retrace of the recent high. EURUSD is currently trading at 1.3273, up 0.3%.


This, in itself, has to be pretty underwhelming for the bullish case.  The AUDUSD saw a similarly apathetic response -- currently up 0.66% to 1.0746 after reaching 1.0777 overnight.  Given that it just broke down from a rising wedge, this .618 retrace smacks of a backtest -- as in "the last thing you see before a rising wedge produces a decent decline."


All this would be interesting enough, but look at what's happening to the eminis.  They reached 1352.25 last night -- a mere .50 from making a new high.  If the the euro itself can't manage at least a 1% rally and 88.6% retrace, why the heck did US stocks go hog wild with a 97% retracement?


I'm glad I asked. Among its failings, the ECB hasn't quite mastered the art of turning a sow's ear into a silk purse.  Perhaps Madison Avenue is too far away, I don't know.  But, TPTB here in the good ol' US of A are very adept at turning any event with even a hint of eau de taureau into a full blown, quantitavish second coming.

BTW, that larger rising wedge you see is the absolute end of the road for wave 2 without a breakout or breakdown.  The key will be whether 1354.32 can hold this morning.  The ideal turning point would be 1352.39, to complete a bearish Bat pattern on the 60-min chart and set up the H&S pattern we discussed last week.

More later.


Saturday, February 11, 2012

More Crabapples: February 11, 2012

ORIGINAL POST:

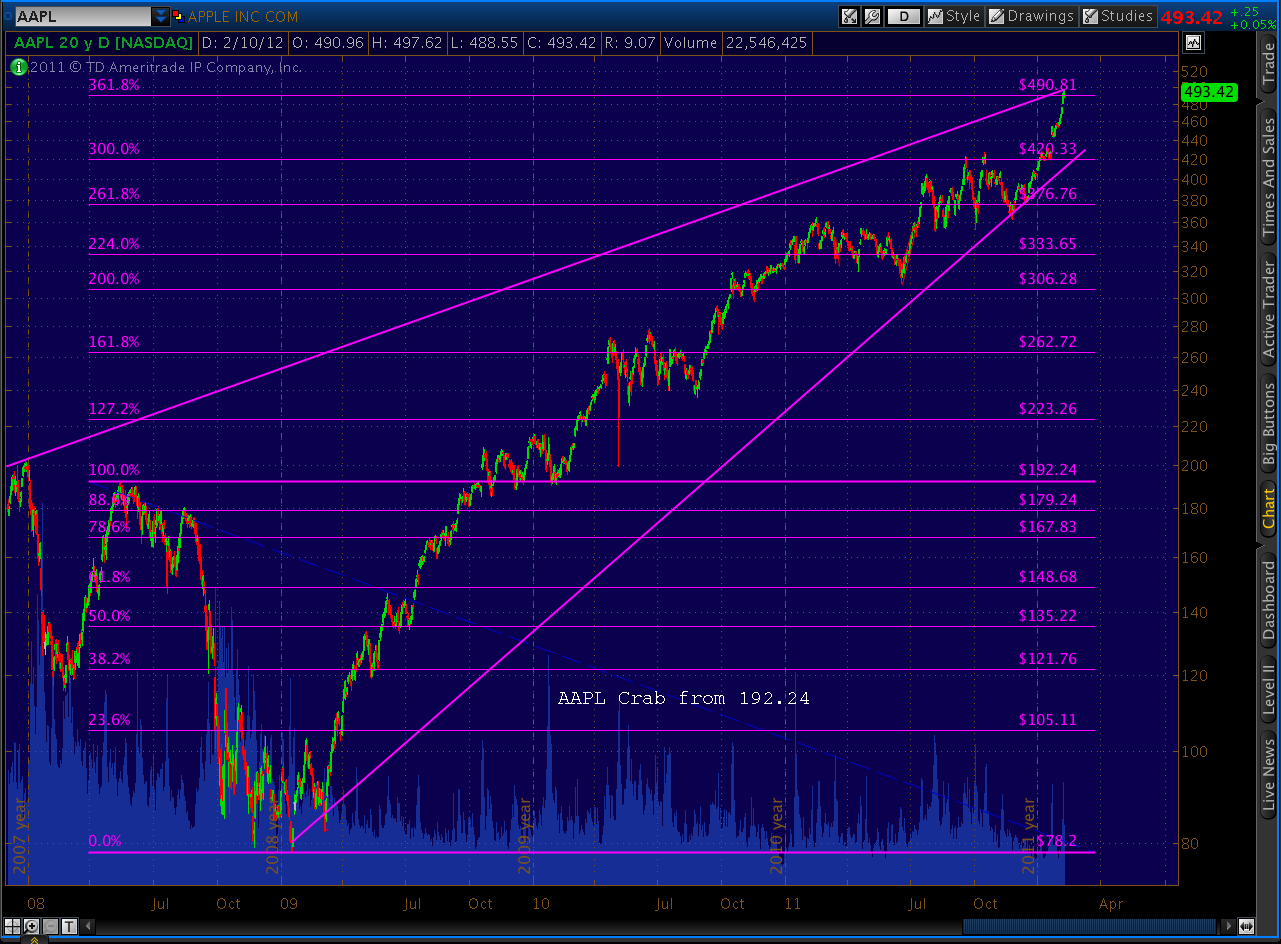
Back on Feb 1, I made a case for 465 as an interim top for AAPL and SPX topping at 1333 [see: Butterflies and Crabapples].  AAPL obliged me by tagging my target on Feb 6, then -- probably to spite me -- tacked on another 28 points, closing at 493.42 Friday.  During that same time, SPX has tacked on another 1.6% which, compared to AAPL's 6%, strikes me as a little "divergency".

Now, inches away from the psychologically important $500/share, is it time to throw in the towel?  Jumping in front of a runaway freight train like AAPL is always a little dicey, but a very precise tag of a 17-year old trend line -- part of an obvious rising wedge -- makes a good argument for an imminent reversal. 


Way up in the tip of that rising wedge, we've completed a Crab within a Crab pattern --  one of my favorite bearish set-ups.  We've overshot the 1.618 and 2.0 extensions on the smaller (red) pattern and are closing in on the 2.24 at 505.29 and the 2.618 at 529.25.


There are two possible Point X's the larger (purple) pattern: 192.24 or 202.96.  Starting at 192.24 puts a 3.618 extension at 490.81, meaning we've already overshot it.  


Starting from 202.96, on the other hand, puts the 3.618 at 529.59 -- only 34 cents from the above-mentioned 2.618 extension for the smaller pattern.


So, we're seemingly stuck with ignoring a coincidence (529.59 v 529.25) or ignoring a very precise tag of a 17 year-old trend line.  Ugh.  It's a little like the SPX and NDX, with ample reason for a reversal right here, right now -- but a decent argument for a little bit higher.

Last time we saw this strong a bearish rising wedge pattern on AAPL was in 2000.  Check out the rising wedge and its aftermath -- an 88.6% retracement.


In 2000, AAPL had also just completed a Crab pattern -- at its 3.618 extension (see below.)   It came with head fakes at the 1.618, 2.24 and 2.618 extensions, so it's not much help in deciphering our current plight.  But, that thin red diagonal trend line is the exact same line as the purple TL on the weekly chart up above.   I have a pretty good feeling about that line...


If it holds, AAPL should reverse very soon -- maybe even Monday.  If it breaks, AAPL could tack on another 7.3% to 529 before cratering.   And, if AAPL craters in any meaningful way, there goes the neighborhood.   Either way, long term holders of this remarkable stock would do well to hedge their downside.

GLTA.

Friday, February 10, 2012

Charts I'm Watching: February 10, 2012


UPDATE:  3:55 PM

The NDX RSI trend line was broken on the daily chart.


VIX to 21.98 intra-day high, up almost 40% this week.

ORIGINAL POST:

VIX has broken out of its falling wedge.  We should see some sort of backtest, which will establish a right shoulder in an inverse H&S pattern, then a run up to 25+.  Note that each target which is fulfilled on an IHS completes another, larger IHS -- in a reverse waterfall of ever-increasing values.


I wrote about the same pattern last July, just prior to the market imploding [see: Do You Feel Lucky?]


But, an IH&S pattern on VIX wouldn't be worth much without a matching H&S pattern on SPX, though, right?  Here's a little one worth watching:


Of course, little ones can turn into bigger ones...


Which can turn into really, really big ones...


More later.

********************

The trend line from May 19, 2008 through May 2, 2011 and yesterday's close.  Note that it connects the wave 2 top in 2008 to what I believe is the wave 2 top in 2012 -- kindred spirits, if you will.  Thanks, again, to RS for pointing it out.


********************

AUDUSD charts, relating to discussion below...